Enhancing Business Intelligence: Strategic Accelerators for Analytics
Unfortunately, 85% of BI projects fail and it is wise to heed analyst warnings against complacency. Adopt agile BI solutions for decisive and tangible outcomes that push your business towards transformative success.
"*" indicates required fields
Capabilities
Elevate BI: Collaboration & Customization Features
Transform how you work with data. Dive into smarter decision-making, seamless data analysis, and fully customized reporting with our BI tools. Experience collaboration like never before, empowering your every insight. With us, your BI journey becomes a beacon of innovation and impact, tailored just for you.
- BI Write-back
- AI & ML Integration
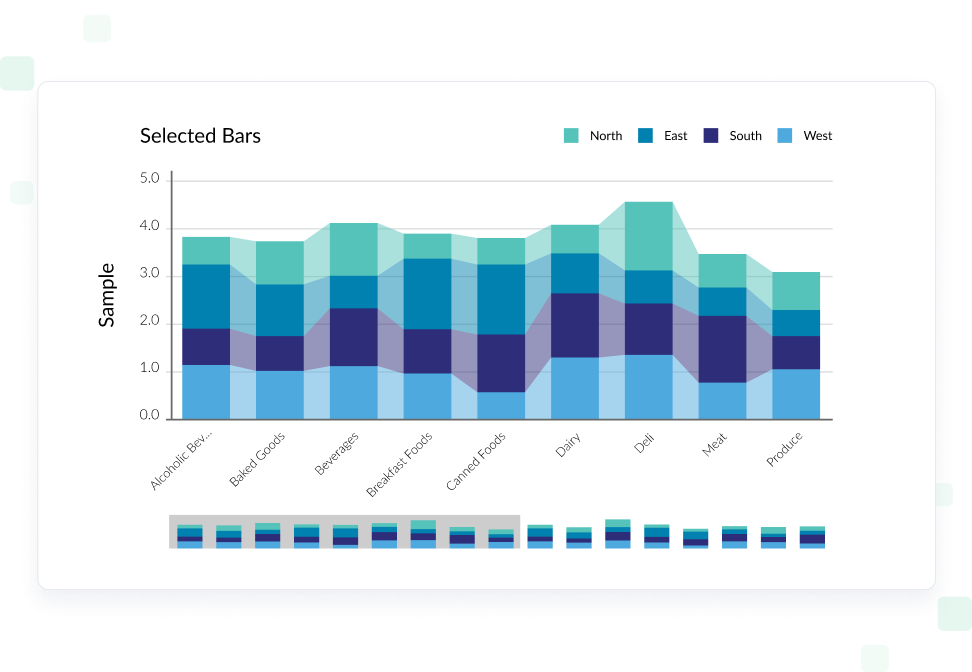
- Visualizations & Dashboards
- Personalized Analytics
- Data Source Connectivity
- Self-Service Tools
- Reporting for Oracle
- xP&A for Power BI
Use Cases
Powerful Business Intelligence Solutions to Drive Your Data Culture
Solve your organizations’ data needs by building workflows directly in your BI tools, upleveling your data visualization capability, and embedding advanced analytics into products and applications.
Competing in today’s world requires you to be able to connect your analysis with decisions and actions. Analysis must be more than read-only dashboards, drill downs, and “export to spreadsheets”. Enabling users to analyze, enter, and manage data all in the same place helps your organization make faster decisions, accelerating business results, and providing long-term value.
Understanding complex data ensures a unified data confidence across an organization. Users must feel empowered to create their own visuals, transforming data into stories. Being able to deliver data-driven business decisions, without the need to depend on IT or BI experts, provides measurable long term value to the organization.
In today’s competitive landscape, it’s essential to integrate analysis at the point of decision making. Beyond static dashboards, empowering users to analyze and manage data in one unified place enhances ROI. Transforming complex data into stories fosters confidence and drives intuitive, data-driven solutions.
Empower your enterprise with a BI solution that outperforms traditional systems. Flexible, AI-driven analysis and advanced visualization unlock actionable insights. Tailored for rapid decision-making, it provides a strategic edge in the fast-paced market, focusing on your needs.
Products to Boost your BI: More Value, More Power, More Insights
Elevate your BI to enterprise-strength BI and embedded analytics. Supercharge Power BI and Qlik into advanced solutions through write-back and improved accessibility. Maximize your applications with predictive analytics and seamless data integrations.
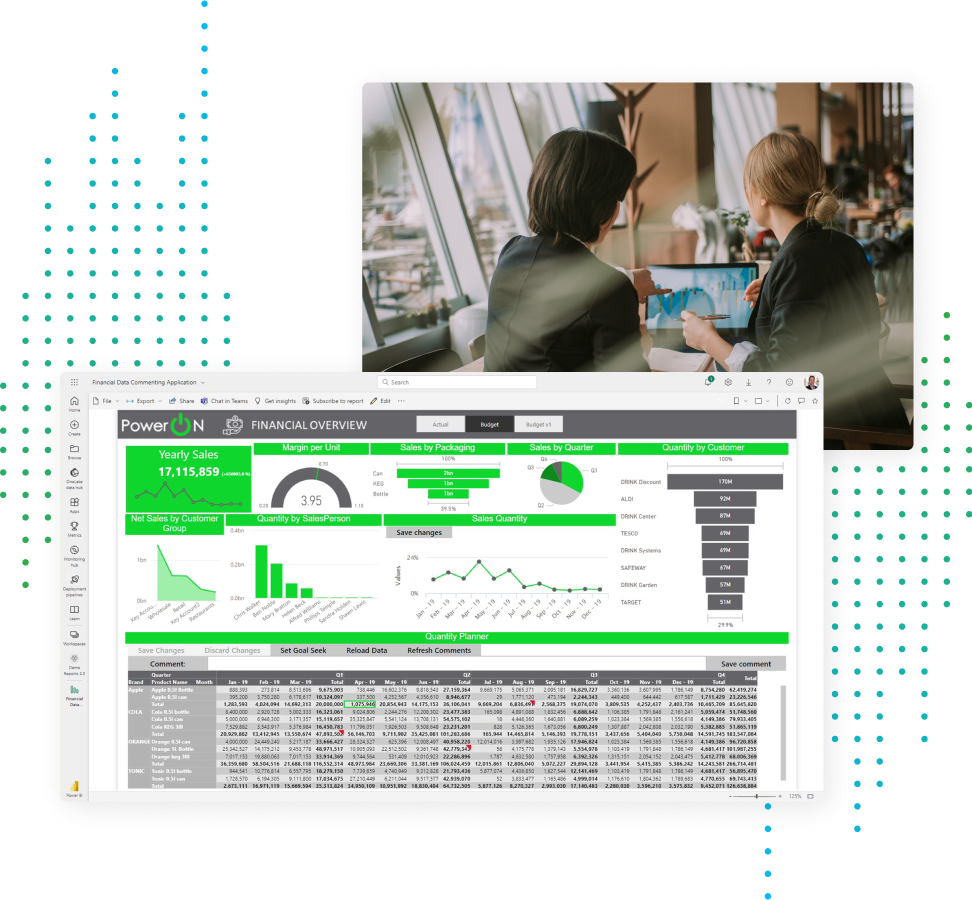
Power ON
Supercharge Power BI with planning and write-back
- Unify and enrich data directly in Power BI
- Break down silos to speed up customization and gain flexibility
- Turn Power BI into a collaboration hub for real time decision making
Vizlib
Unleash the full power of Qlik Sense and Qlik Cloud
- Enhance your visualizations with advanced functionality
- Make data-driven decision making accessible to everyone
- Maximize your Qlik investment by transforming data capture and interaction
Logi Symphony
Expand Applications: AI Dashboards & Data Insights
- Custom Dashboards: Actionable Insights for Decision-Making
- Advance with Predictive & AI Analytics in Your Apps
- Seamless Data Integration for Real-Time Intelligence
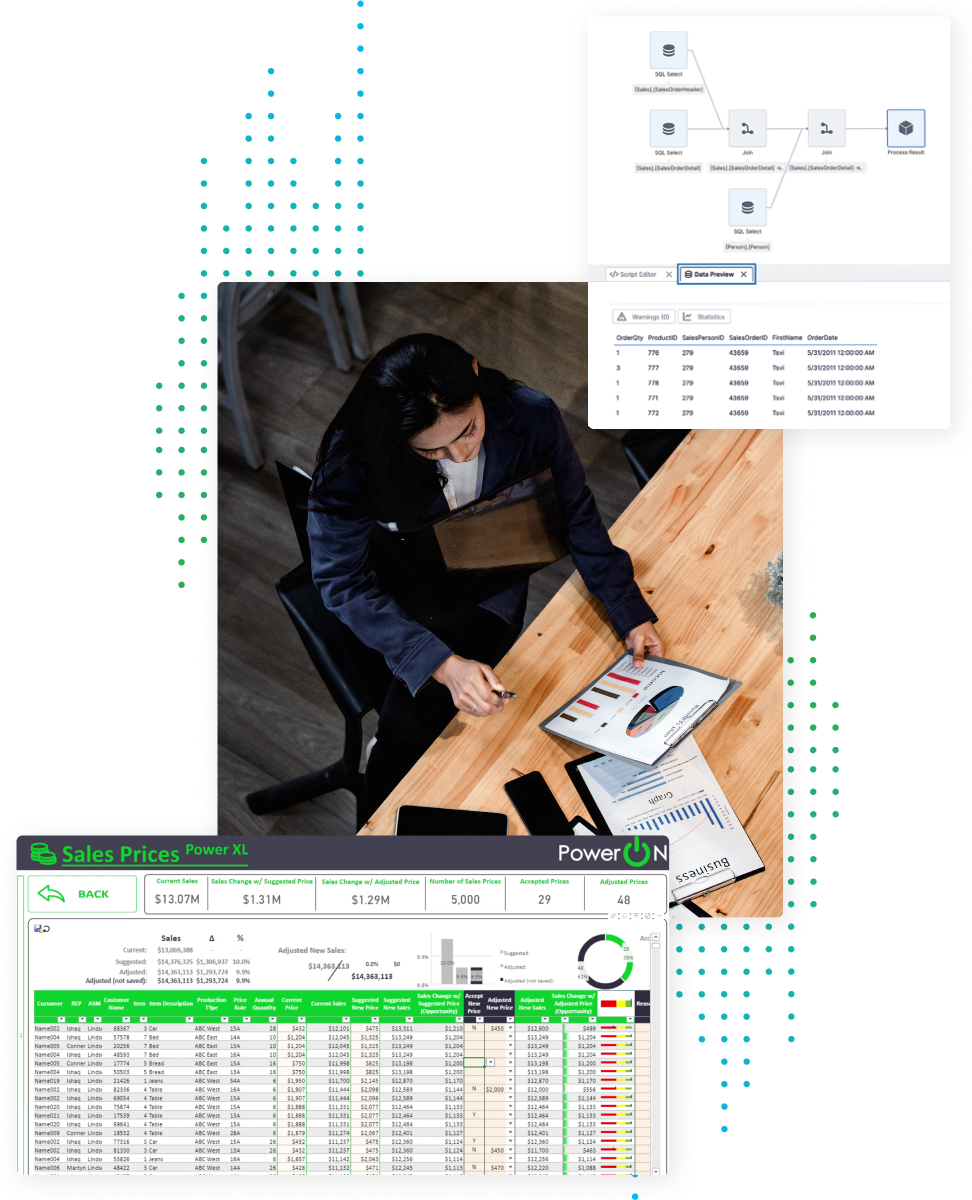
Simba Drivers & SDK
Maximize Application Potential with Advanced Data Integration
- Seamlessly Bridge Applications to Any Data Source for Optimal Access and Security
- Enable Agile Decision-Making with Instant, Real-Time Data Access
- Leverage Universal SQL Querying for Comprehensive Data Analysis
Roles & Industries
Get the Most Out of Your Analytics Investment
Business Intelligence and Analytics software empowers diverse roles and industries, providing data insights for decision-makers, and streamlining processes for operational efficiency across your organization.

Product Manager
Product Managers integrate analytics for enhanced features, revenue boost, and competitive edge. They seek partnerships for data expertise, risk mitigation, and cost reduction through efficient tools for content delivery, saving time.

BI Manager / Implementer
BI Managers aim to deliver actionable insights to end-users through dashboards. They need efficient tools for content creation, ensuring a balance between quality and timely delivery, enhancing overall user experience.

Application Developer
Application Developers are vital for integrating embedded analytics software into applications, ensuring a smooth connection. Their focus on seamless integration enables users to access powerful analytics features within the application context.

C-suite
C-level executives champion data visualization and BI to cultivate a data-driven culture and enable actionable decision-making. They transform complex data into insights, guiding strategic goals and competitive advantage.

Healthcare
Distilling big data into bite-sized chunks for practitioners, clinicians, nurses and support staff is vital for the success of healthcare organizations. Our data analytics solutions help end users better and more easily visualize their data for efficient and life-saving decision making.

Financial Technology
Empowering fintech with analytics, we transform complex financial data into actionable insights for risk and compliance. Our solutions support firms in enhancing security, improving service, and streamlining decisions for a robust financial ecosystem.

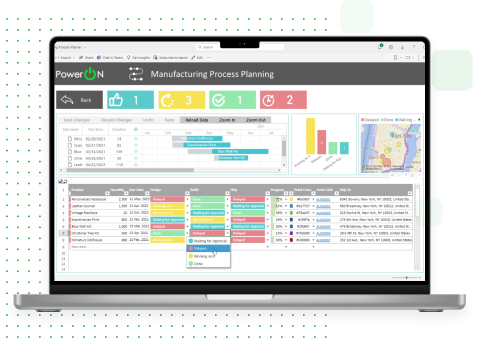
Manufacturing
Manufacturers rely on up-to-date information to maintain and optimize everything from plant floor activities to logistics. Our BI solutions help streamline your operations to better support your strategic goals.

Government
Enhanced Business Intelligence (BI) and analytics empower governments and agencies with the right solutions allowing for smarter policymaking, reimagined service delivery, and more efficient operations. By harnessing data insights, governments can better serve citizens while optimizing taxpayer resources.

Nonprofits
Not-for-profit organizations thrive with enhanced Business Intelligence (BI) and analytics. It fuels faster, better data-driven decisions, streamlines operations, reduces costs, and amplifies impact.

Retail
Retail organizations can grow and thrive with data-driven insights. Our enhanced Business Intelligence (BI) solutions fuel strategic pricing, enable supply chain optimization, improve inventory management, and drive customer satisfaction.

Energy & Utilities
Energy & Utility companies excel with data-driven insights. Enhanced Business Intelligence (BI) and analytics fuels power outage prediction, equipment maintenance decisions, system efficiency, effective load management, and improved customer service.
Webinars & Resources
Take a look at our upcoming and on-demand Business Intelligence and Analytics webinars packed with handy tips, best practices, and insights, brought to you by insightsoftware’s product and solutions experts.


Supercharge Power BI with Write-back & Planning

2024 & Beyond: Revealing Vizlib’s Product Roadmap
FAQs
Adopting specialized BI solutions can significantly enhance project outcomes, overcoming the common issue of trying to fit square pegs into round holes—where businesses expect incumbent BI products to meet all needs universally. Agile approaches ensure more tailored, effective solutions, leading to decisive success and transformative results.
Strategic accelerators not only introduce advanced features like BI write-back, actionable analytics, AI & ML predictions, and enhanced visuals, but they can also augment your existing BI technology stack or replace it altogether. This flexibility allows for precision and customization tailored to specific business needs.
insightsoftware offers products specifically designed to enhance Power BI and Qlik Sense offerings, addressing challenges such as limited dynamic data use, missing data connectivity, and loose embedded analytics, facilitating more effective data exploration and decision-making.
Real-time connectivity transforms BI tools by ending the cycle of delayed reporting. Immediate access to insights and trends empowers proactive decision-making, enhancing strategic actions with comprehensive, seamless data integration.
Embedded analytics improve end-user experience with data insights, offer faster “time to value” in expanding product offerings, and reduce tech debt, enabling quicker market entry.
Looking for inspiration? Browse and sample our library of interactive dashboards – created with Logi Symphony.